
Chapter II Patent Application and Examination
1. Patent Applications
In 2004, SIPO received 353,807 patent applications for three types of inventions, showing an increase of 45,320 or 14.7% year on year.Patent filings showed the following features:
(1) With regard to the number of applications for the three types of patents, invention, utility model and design broke 110,000, 130,133 for invention, an increase of 24,815 or 23.6%, 112,825 for utility model, an increase of 3,710 or 3.4%, 110,849 for design, an increase of 16,795 or 17.9%. The number of patent applications were still well-divided, invention accounting for 36.8%, utility model 31.9% and design 31.3%.
(2) According to the domestic and foreign filings of all three types, most of the domestic applications still were patents for utility models and industrial designs, the proportion of patents for inventions increased 1% to 23.6%, while most of the foreign ones were patents for inventions, accounting for 86%.
Table 1 Applications for Three Kinds of Patents According to Service and Non-Service in 2004
| Kinds of Patents | Total | Domestic | Foreign | ||||||||
| Total (B) | Service (A) | Non-Service (A) | Total (B) | Service (A) | Non-Service (A) | Total (B) | Service (A) | Non-Service (A) | |||
| Accumulated Total
|
Number of Applications | 2284925 | 1061406 | 1223519 | 1874358 | 670264 | 1204094 | 410567 | 391142 | 19425 | |
| %(A/B) | 100.0% | 46.5% | 53.5% | 100.0% | 35.8% | 64.2% | 100.0% | 95.3% | 4.7% | ||
|
This Year
|
Total | Number of Applications | 353807 | 183317 | 170490 | 278943 | 111280 | 167663 | 74864 | 72037 | 2827 |
| %(A/B) | 100.0% | 51.8% | 48.2% | 100.0% | 39.9% | 60.1% | 100.0% | 96.2% | 3.8% | ||
| Invention | Number of Applications | 130133 | 103863 | 26270 | 65786 | 41750 | 24036 | 64347 | 62113 | 2234 | |
| %(A/B) | 100.0% | 79.8% | 20.2% | 100.0% | 63.5% | 36.5% | 100.0% | 96.5% | 3.5% | ||
| Utility Model | Number of Applications | 112825 | 36238 | 76587 | 111578 | 35218 | 76360 | 1247 | 1020 | 227 | |
| %(A/B) | 100.0% | 32.1% | 67.9% | 100.0% | 31.6% | 68.4% | 100.0% | 81.8% | 18.2% | ||
| Design | Number of Applications | 110849 | 43216 | 67633 | 101579 | 34312 | 67267 | 9270 | 8904 | 366 | |
| %(A/B) | 100.0% | 39.0% | 61.0% | 100.0% | 33.8% | 66.2% | 100.0% | 96.1% | 3.9% | ||
Table 2 Distribution of Domestic Non-Service and Service Applications, 2004
| Total | Non-Services | Service | ||||
| Total | Universities and Colleges | Scientific Research Institute | Enterprises | Organizations | ||
| 278943 | 167663 | 111280 | 12997 | 6709 | 90148 | 1426 |
| (B/A) | 11.7% | 6.0% | 81.0% | 1.3% | ||
Table 3 Distribution of Domestic Service Applications, 2001-2004
| 2001 | 2002 | 2003 | 2004 | |
| Total | 60104 | 81242 | 102456 | 111280 |
| Universities and Colleges | 3810 | 5981 | 10252 | 12997 |
| Scientific Research Institutes | 4360 | 5373 | 6998 | 6709 |
| Enterprises | 51302 | 68962 | 84117 | 90148 |
| Organizations | 632 | 926 | 1089 | 1426 |
Table 4 Top Ten Foreign Corporations According to Their Applications in 2004
| No. | INID | Name of Corporation | Number |
| 1 | JP | Matsushita | 2813 |
| 2 | KR | Samsung Electronics | 2371 |
| 3 | NL | Philips | 1930 |
| 4 | JP | Sony | 1289 |
| 5 | KR | LG | 1164 |
| 6 | JP | SEIKO | 1075 |
| 7 | JP | Toshiba | 915 |
| 8 | JP | Sanyo Electronics | 898 |
| 9 | JP | Canon | 843 |
| 10 | US | IBM | 829 |
Table 5 Top Ten Domestic Universities and Colleges According to Their Applications in 2004
| No. | Name of Universities and Colleges | Number |
| 1 | Zhejiang Univ. | 875 |
| 2 | Shanghai Jiaotong Univ. | 829 |
| 3 | Tsinghua Univ. | 762 |
| 4 | Fudan Univ. | 355 |
| 5 | Tianjin Univ. | 327 |
| 6 | Haerbin Industial Univ. | 271 |
| 7 | Jiangnan Univ. | 264 |
| 8 | South China Science and Engineering Univ. | 238 |
| 9 | Nanjing Univ. | 236 |
| 10 | Huazhong Univ. of Science and Technology | 221 |
Table 6 Top Ten Domestic Scientific Research Institutes According to Their Applications in 2004
| No. | Name of Scientific Research Institute | Number |
| 1 | Shanghai Light Mechanics Institute, Chinese Academy of Sciences | 288 |
| 2 | Petrochemical Science Institute,SINOPEC | 222 |
| 3 | Guiyang Al & Mg Design Institute | 180 |
| 4 | Industry Technology Research Institute | 161 |
| Dalian chemistry and Physics Institute,Chinese Academy of Sciences | 161 | |
| 6 | Fushun Petrochemical Science Institute,SINOPEC | 117 |
| Metal Institute, Chinese Academy of Sciences | 117 | |
| 8 | Changchun Light Mechanics and Physcis, Chinese Academy of Sciences | 107 |
| 9 | Computing Technology Institute, Chinese Academy of Sciences | 105 |
| 10 | Semiconductor Institute, CAS | 102 |
| Shanghai Petrochemical Science Institute,SINOPEC | 102 |
Table 7 Top Ten Domestic Enterprises According to Their Applications in 2004
| No. | Name of Enterprises | Number |
| 1 | LG Electronics (Tianjin) | 2327 |
| 2 | Huawei Technology | 2176 |
| 3 | Hon Hai Precision Industry | 1385 |
| 4 | Lifan (Chongqing) | 1293 |
| 5 | Hong Fu Jin Precision Industry (Shenzhen) | 1224 |
| 6 | ZTE Telecommunications | 642 |
| 7 | SINOPEC | 565 |
| 8 | LG Electronics (China) R & D Center | 513 |
| 9 | Shanghai LG | 448 |
| 10 | Beng | 416 |
Table 8 Top Ten Foreign Corporations According to Their Applications of Invention in 2004
| No. | INID | Name of Corporation | Number |
| 1 | JP | Matsushita | 2423 |
| 2 | KR | Samsung Electronics | 2241 |
| 3 | NL | Philips | 1840 |
| 4 | JP | Sony | 1112 |
| 5 | JP | SEIKO | 1005 |
| 6 | KR | LG | 940 |
| 7 | US | IBM | 829 |
| 8 | JP | Canon | 827 |
| 9 | JP | Toshiba | 811 |
| 10 | JP | Sanyo Electronics | 784 |
Table 9 Top Ten Domestic Universities and Colleges According to Their Applications of Invention in 2004
| No. | Name of Universities and Colleges | Number |
| 1 | Shanghai Jiaotong University | 791 |
| 2 | Tsinghua University | 676 |
| 3 | Zhejiang University | 642 |
| 4 | Fudan University | 335 |
| 5 | Tianjin University | 257 |
| 6 | Haerbin Industial University | 255 |
| 7 | Nanjing University | 211 |
| 8 | Sichuan University | 186 |
| 9 | South China Science and Engineering University | 165 |
| 10 | Tongji University | 161 |
Table 10 Top Ten Domestic Scientific Research Institutes According to Their Applications of Invention in 2004
| No. | Name of Scientific Research Institute | Number |
| 1 | Shanghai Light Mechanics Institute, Chinese Academy of Sciences | 236 |
| 2 | Petrochemical Science Institute,SINOPEC | 214 |
| 3 | Industry Technology Research Institute | 153 |
| 4 | Dalian chemistry and Physics Institute,Chinese Academy of Sciences | 148 |
| 5 | Fushun Petrochemical Science Institute,SINOPEC | 109 |
| 6 | Computing Technology Institute, Chinese Academy of Sciences | 105 |
| 7 | Semiconductor Institute, CAS | 97 |
| 8 | Changchun Light Mechanics and Physcis, Chinese Academy of Sciences | 96 |
| 9 | Metal Institute, Chinese Academy of Sciences | 95 |
| 10 | Shanghai Petrochemical Science Institute,SINOPEC | 92 |
Table 11 Top Ten Domestic Enterprises According to Their Applications of Invention in 2004
| No. | Name of Enterprises | Number |
| 1 | LG Electronics (Tianjin) | 2309 |
| 2 | Huawei Technology | 2011 |
| 3 | Hong Fu Jin Precision Industry (Shenzhen) | 671 |
| 4 | ZTE Telecommunications | 599 |
| 5 | Hon Hai Precision Industry | 552 |
| 6 | SINOPEC | 532 |
| 7 | LG Electronics (China) R & D Center | 485 |
| 8 | Shanghai LG | 448 |
| 9 | AUO | 386 |
| 10 | Beng | 330 |
(3) With regard to the constitution of all invention patent applications, domestic applications of patents for inventions were 65,786, and 64,347 were foreign applications. Domestic applications still had an upper hand over the foreign ones.
By December 31,2004, an accumulated number of 2,284,925 patent applications were filed with SIPO. Among them, 1,874,358 were domestic filings, accounting for 82% of the total, and 410,567 were foreign applications, accounting for 18%.
Since China officially became a member state of the Patent Cooperation Treaty (PCT) in 1994, by December 31,2004, SIPO received a total of 7,129 international applications. 7,215 international search copies, and established 6,210 international search reports. SIPO also received 3,508 demands for international preliminary examination, and 2,959 international preliminary examination reports. Of the 158,026 international applications entering China's national phase, 157,968 filings were for invention patents and 58 for utility models.
In 2004, SIPO received 1,592 international applications, 1,797 international search copies, and established 1,274 international search reports. SIPO also received 518 requests for international preliminary examination, and established 534 reports. Of the 32,438 international applications entering China's national phase, 32,421 filings were for invention patents and 17 for utility models.
2. Distribution of Patent Applications by Region, Industry and Country
As compared with the previous year, the ranking changed with regard to the number of domestic patent applications in 2004. The top ten provinces were Guangdong, Zhejiang, Jiangsu, Shanghai, Beijing, Shandong, Taiwan, Liaoning, Tianjin, Hubei.
In 2004, domestic service and non-service applications shared same proportions as the previous year. The proportions of invention applications out of all service applications increased. The number of service patent applications filed by domestic applicants reached 111,280, a rise of 8.6% against 8,824 of the previous year, 41,750 for invention, an increase of 7,019 or 20.2%. The number of patent applications filed by domestic enterprises was 90,148, an increase of 6,031 or 7.2%. The number of patent appli cations filed by domestic colleges and universities was 12,997, an increase of 2,745 or 26.8%.
Table 12 Top Ten Provinces and Municipalities According to Their Applications Filed in 2004
| No. | Provinces or cities | Number |
| 1 | Guangdong | 52201 |
| 2 | Zhejiang | 25294 |
| 3 | Jiangsu | 23532 |
| 4 | Shanghai | 20471 |
| 5 | Beijing | 18402 |
| 6 | Shandong | 18388 |
| 7 | Taiwan | 17841 |
| 8 | Liaoning | 14695 |
| 9 | Tianjin | 8406 |
| 10 | Hubei | 7960 |
Table 13 Top Ten Countries According to Their Applications Filed in 2004
| No. | States | Number |
| 1 | Japan | 30444 |
| 2 | Unite States | 16187 |
| 3 | Korea | 6660 |
| 4 | Germany | 5917 |
| 5 | the Netherland | 2960 |
| 6 | France | 2465 |
| 7 | Swiss | 1744 |
| 8 | the UK | 1401 |
| 9 | Italy | 1167 |
| 10 | Sweden | 899 |
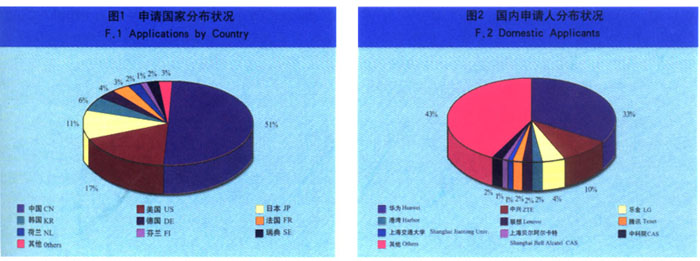
By December 31,2004, 127 countries and regions had filed their applications in China. In the year 2004,China received applications from 86 countries and regions, for 1 of which it was the first time to file applications in China. The newcomer was Cameroon. The top ten countries in terms of the number of patent applications were Japan, USA, the Republic of Korea, Germany, Netherlands, France, Switzerland, United Kingdom, Italy and Sweden.
3. Distribution of Patent Applications by Technical Field
In 2004, 240,026 applications for inventions and utility models were classified according to IPC, an rise of 44,903 or 23% over the previous year.
As far as the IPC classification of invention patent applications in 2004 was concerned, patent filing in 2004 showed the following features:
(1) Applications relating to preparations for medical, dental, or toilet purposes (A61K) led for the 13th consecutive year, among them up to 75% were domestic applications. Applications relating to electric digital processing (G06F) ranked 2nd, domestic applications accounted for more than 50.0% of the total applications. Applications related to transmission of digital information (H04L) ranked the 3rd, more than 50% of which were from domestic applicants. Applications related to medicine (A61K) and electronic data processing (G06F) ranked among the top three for the ninth consecutive year.
(2) The top ten subclasses that were led by foreign applications changed with those of the previous year. Transmission of digital information (H04L) climbed from the 7th to 3rd. The applications dominating in proportion were related to information saving (G11B), semiconductor component (H01L),optical device and optical system (G02B) each accounting for over 65% of the total in their respective subclass. Transmission of digital information (H04L) had the largest increase with 173%.
Table 14 Applications for Patents for Inventions and Utility Models Classified According to IPC in 2004
| A-H Total | A | B | C | D | E | F | G | H | |
| Accumulated Total | 1643822 | 377236 | 321538 | 157808 | 36209 | 107936 | 214092 | 211668 | 217335 |
| 100.0% | 22.9% | 19.6% | 9.6% | 2.2% | 6.6% | 13.0% | 12.9% | 13.2% | |
| Total in 2004 | 240026 | 47173 | 41558 | 21163 | 4795 | 14671 | 28567 | 38768 | 43331 |
| 100.0% | 19.7% | 17.3% | 8.8% | 2.0% | 6.1% | 11.9% | 16.2% | 18.1% | |
| Invention | 122238 | 18447 | 14421 | 18419 | 2686 | 3118 | 9566 | 25545 | 30036 |
| 100.0% | 15.1% | 11.8% | 15.1% | 2.2% | 2.6% | 7.8% | 20.9% | 24.6% | |
| Utility Model | 117788 | 28726 | 27137 | 2744 | 2109 | 11553 | 19001 | 13223 | 13295 |
| 100.0% | 24.4% | 23.0% | 2.3% | 1.8% | 9.8% | 16.1% | 11.2% | 11.3% |
Table 15 Top Ten IPC Sub-Classes of Applications for Patent for Inventions in 2004
| Total | Sub-class | Number | Residents | Sub-class | Number | Non-Residents | Sub-class | Number |
| 1 | A61K | 6816 | 1 | A61K | 5061 | 1 | G06F | 3198 |
| 2 | G06F | 6579 | 2 | G06F | 3381 | 2 | H01L | 3011 |
| 3 | H04L | 5033 | 3 | H04L | 2782 | 3 | H04L | 2251 |
| 4 | H01L | 4405 | 4 | A23L | 1469 | 4 | H04N | 2019 |
| 5 | H04N | 3268 | 5 | H01L | 1394 | 5 | G11B | 2002 |
| 6 | G11B | 2770 | 6 | G01N | 1380 | 6 | A61K | 1755 |
| 7 | H04Q | 2409 | 7 | H04Q | 1345 | 7 | H04B | 1195 |
| 8 | G01N | 2015 | 8 | H04N | 1249 | 8 | G02F | 1173 |
| 9 | H04B | 1980 | 9 | C12N | 949 | 9 | G02B | 1066 |
| 10 | G02F | 1942 | 10 | F24F | 785 | 10 | H04Q | 1064 |
| H04B | 785 |
Table 16 Top Ten IPC Sub-Classes of Applications for Patent for Utility Models in 2004
| Total | Sub-class | Number | Residents | Sub-class | Number |
| 1 | B65D | 3041 | 1 | B65D | 3004 |
| 2 | H01R | 2252 | 2 | H01R | 2173 |
| 3 | G06F | 2128 | 3 | G06F | 2101 |
| 4 | A47J | 1921 | 4 | A47J | 1905 |
| 5 | A47G | 1761 | 5 | A47G | 1751 |
| 6 | E21B | 1685 | 6 | E21B | 1677 |
| 7 | F16K | 1661 | 7 | F16K | 1653 |
| 8 | A61M | 1647 | 8 | A61M | 1641 |
| 9 | A61B | 1484 | 9 | A61B | 1475 |
| 10 | E06B | 1389 | 10 | E06B | 1372 |
Table 17 Three Kinds of Domestic and Foreign Patents Granted According to Service and Non-Service in 2004
| Kinds of Patents | Total | Domestic | Foreign | ||||||||
| Total (B) | Service (A) | Non-Service (A) | Total (B) | Service (A) | Non-Service (A) | Total (B) | Service (A) | Non-Service (A) | |||
| Accumulated Total | Number of Granted | 1255499 | 568408 | 687091 | 1093268 | 413740 | 679528 | 162231 | 154668 | 7563 | |
| %(A/B) | 100.0% | 45.3% | 54.7% | 100.0% | 37.8% | 62.2% | 100.0% | 95.3% | 4.7% | ||
| This Year | Total | Number of Granted | 190238 | 100075 | 90163 | 151328 | 62565 | 88763 | 38910 | 37510 | 1400 |
| %(A/B) | 100.0% | 52.6% | 47.4% | 100.0% | 41.3% | 58.7% | 100.0% | 96.4% | 3.6% | ||
| Invention | Number of Granted | 49360 | 42265 | 7095 | 18241 | 12176 | 6065 | 31119 | 30089 | 1030 | |
| %(A/B) | 100.0% | 85.6% | 14.4% | 100.0% | 66.8% | 33.2% | 100.0% | 96.7% | 3.3% | ||
| Utility Model | Number of Granted | 70623 | 26703 | 43920 | 70019 | 26218 | 43801 | 604 | 485 | 119 | |
| %(A/B) | 100.0% | 37.8% | 62.2% | 100.0% | 37.4% | 62.6% | 100.0% | 80.3% | 19.7% | ||
| Design | Number of Granted | 70255 | 31107 | 39148 | 63068 | 24171 | 38897 | 7187 | 6936 | 251 | |
| %(A/B) | 100.0% | 44.3% | 55.7% | 100.0% | 38.3% | 61.7% | 100.0% | 96.5% | 3.5% | ||
Since 98.9% applications for utility models in 2004 were domestic applications, the ranking reflected the overall status of domestic utility model applications. For utility model filings, those related to containers or packaging for storage or transportation of materials (B65D) ranked 1st for the eleventh consecutive year. Applications relating to electric transmission linkage (H01R) ranked 2nd,applications related to electronic data processing (G06F) ranked 3rd.
4. Patent Examination and Granting
By December 31, 2004, SIPO had granted an accumulated total of 1,255,499 patents. In 2004, 190,238 patents were granted, with an increase of 4.4% or 8,012 over the previous year.
In 2004, 49,360 applications for patents for invention were published, an increase of 12,206 or 32.9%. As far as utility models were concerned, 70,623 were granted in 2004, with an increase of 1,717 or 2.5%. 70,255 patents for industrial designs were granted, with a decline of 7.8% or 5,911 over the previous year.
5. Analysis and Forecast on Patent Applications Relating to Hybrid Electric Vehicle Technology (continued)
At the moment hybrid electric vehicle (HEV) is the best accepted project by market, among the projects for solving the environmental and energy sources? problems, which are up against the vehicle industry. Market demand is an important aspect to decide the situation of patent applications. The great potential market of HEV in China has attracted many motor corporations to enter and take possession of it. In September, the TOYOTA MOTOR CO. LTD. of Japan and the FIRST AUTOMOBILE GROUP CORP. (FA) of China subscribed a cooperating agreement, in which they confirmed that TOYOTA will manufacture HEV in FA, the HEV will refer to the technique mature HEV “Prius” of TOYOTA, simultaneously hybrid power system of TOYOTA will be applied to the vehicle of FA's trademark. In October, GENERAL MOTORS of UNITED STATES and SHANGHAI AUTOMOBILE GROUP CORP. signed a cooperating conversion, they prepared for the exploitation and commercial operation of HEV. In November, the HONDA MOTOR CO. LTD also hoped that they can start to produce their HEV in CHINA soon.The situation of patent application on HEV in CHINA reflects such market demand, in this year applicants of the applications on HEV in CHINA mainly focuses on several Japanese automobile company: TOYOTA, HONDA, NISSAN, HINO.
As a portion of electric vehicle major project in 863 Program in the tenth Five-Year plan period, research and development (R&D) of HEV technology, which is launched by the State Ministry of Science and Technology, has achieved outstanding achievement. Many R&D units have filed related patent applications. This year is the pivotal period of the second phase, there are many patent applications on entire cars and key components, and it has greatly upgraded our HEV products?competitive power.
The subject matters of the applications on HEV in this year mainly focus on control technology for HEV, in which dual control to the internal-combustion engine driving system and the electric motor driving system is the significant control technology. Now modern computer and automatic control technologies, of which the core is computer, are in general use. Various intelligent control systems, for example, self-adaptation control system, expert control system, fuzzy control system and nerve net control system are all applied to HEV. They make the dynamic performance of HEV reach or approach the level of modern internal-combustion engine vehicle, make HEV furthest exert the auxiliary effect of electric motor driving, and make HEV much more safe, energy saving, comfort, and environment protecting. Along with ceaseless innovation and maturation of its technology, HEV will gradually be the mainstream of vehicles.
6. Analysis and Forecast on Patent Applications Relating to Network Technology
In recent years, the technology in the field of transmission of digital information has been rapidly developed, especially in the field of network technology. And the core technology research in this filed in our country is approaching the international level and evenly keeps ahead of the world, such as the network security authentication, value-added service, etc.. Division from the patent point of view, the transmission of digital information belongs to the international patent classification H04L.
According to incomplete statistics, from Jan.1, 2004 to Nov.30, 2004, the amount of invention patent based on the international patent classification H04L reaches to 4,144. Among them, foreign patent application amount is 2,030, accounting for 48.99% of the total, and the total filed from America, Japanese, Korea, German, France, Holland, Finland and Sweden is 1,915, accounting for 94.33% of the foreign total, and mainly filed by several large corporations. Domestic patent applications is 2,114(including 171 filed from Taiwan), accounting for 51.01% of the total. For the first time the domestic patent application amount in this field is overreach the foreign amount. Not only the amount is added, but also the patent applications are related to newer and higher technical levels. And the intelligent grouping & resource-sharing (IGRS) criterion has been set up on the base of patent pool related to home network, which breaks the monopolization of high technology in the field of network communications by the foreign corporations and shows the great achievement that our country has possessed the proprietary intellectual property rights in the field. The patent applications were mainly filed by several large corporations such as the Huawei Tech Co Ltd, ZTE Communication Co Ltd Shenzhen, LG Electrinics Tianjin Electric Appli, Beijing Harbor Network Co Ltd, Lenovo Beijing Co Ltd etc. and some universities, research institutions such as Univ Shanghai Jiaotong, Univ Beijing Posts & Telecom, Univ Beijing Aeronautics & Astronautics, Univ Tsinghua, Chinese Academy of Sciences etc..
The primary technical content of these patent applications relates some aspects. First, patent applications relate to network access security authentication (H04L9/00), the amount is 474, including Network access, user identity identifying, invasion detecting, digital signature control, key verification, data encryption and decryption. Second, patent applications relate to network value-added service and payment (H04L12/00,H04L12/14, H04L12/16), the amount is 417, including network gaming, video meeting system, web content download, tax control on line, electrical business, remote teaching, and network service billing. Third, patent applications relate to network maintenance, administration, monitoring and testing(H04L12/24,H04L12/26), the amount is 513, including Internet firewall, web content filtering, link maintenance and monitoring, lawful interception, pre-warning service, and network QoS. Fourth, patent applications relate to network configuration (H04L12/28, H04L12/54), the amount is 1266, including home network system, network resource management, such as IP address management, route allocation and control, and bandwidth allocation. Fifth, patent application related to baseband system and modulated carrier system (H04L25/00, H04L27/00), the amount is 338, including channel estimation and equalization, noises suppress and power offset in the orthogonal frequency division multiplexing system.
Now many organizations, institutions and incorporations of the world are researching the next generation networks (NGN). But the research is not ripeness and is only gives some intension or primary scheme. So Networks Integrating represents the main development direction of the network communications. Said Networks Integrating is that which can satisfy different demand, such as remote teaching, telecommuting, network conference etc, through a unite network platform integrated with different networks that can supply the voice, data and video service. So the related technology to realize the network integrating, that is next generation networks (NGN), becomes more active, and its development prospect also becomes more extensive, especially some key technologies about NGN, such as softswitch (including media gateway control, calling control, and value-added service), Ipv6, network core router (converge router), virtual private network, network manager, network processor, IP QoS, and technology related to added value service. And also the patent applications in the field will be rapidly increased.
7. Analysis and Forecast on Patent Applications in Dairy Industry
Dairy industry is one of the most rapidly developed industries in recent years. With the great improvement of the standard of living、support of consumption policy and the distinct development of the progress of the urbanization, more and more entrepreneurs are attracted by the margin and good prospect of the dairy industry. According to statistics of the national Statistics Department, from January to June 2004, the gross output value of the dairy product enterprises is 191.23 hundred millions yuan, an increase of 36.82% of previous year, and the output of the dairy product is 681 thousands tons, an increase of 30.97%; the output of the liquid milk is 2.4607 millions ton, an increase of 63.27%. There is an absolutely large consumption market of the dairy product in China because of the realization of the consumer's pursuit of health and the change of their attitude to the milk product, the demand of the milk product will increase continuously. But, the number of the patent applications is too poor compared with the enormous consumption expenditure. Whereas it is predicted that the prospect of the dairy product will become brighter and broader.
(1) the Quantity and ratio of the domestic invention improved abruptly
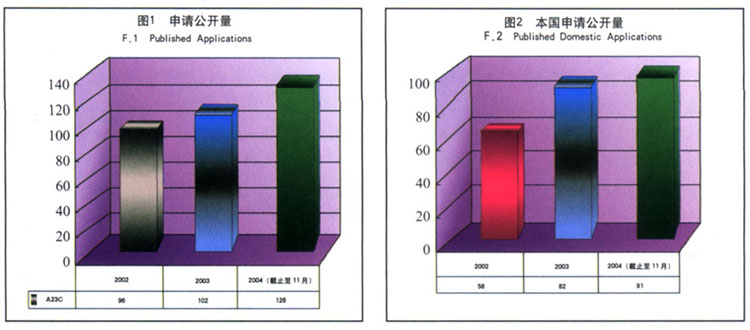
Figure 1 indicates by November 31,2004,the number of the patent applications published in china every year from 2002 to 2004,figure 2 indicates the number of domestic application published in every year. in 2002,the accumulated number of domestic applications published is 58 pieces, accounted for 60.4% of the total number of 96.In 2003,domestic patent applications published reached 82 pieces, accounted for 80.4% of the total number of 102, and in 2004, the number of domestic patent applications published increased to 91 pieces ,accounted for 72.2% of the total. The number of domestic applications increases as the number of the total patent applications increased. It is predicted that the patent application titled about dairy product will increase rapidly, just as the consumption increases.
(2) Non-service inventions are majority while service inventions increased year after year
In addition, According to the distribution of applicant, the ratio of service invention is also increased year after year. Table 1 indicates by Novermber 31,2004,the number of domestic service applications every year between 2002 and 2004. As indicated in table 1, the ratio of the number of domestic service patents reached 36.2% of the total applied in China in 2004, increased 22.4% and 23.2% greatly compared with 2002 and 2003. In the other word, the increase of the number of domestic patent applications is due to the patented applied by enterprises、colleges and scientific research institutes.
And if ,according to the distribution of applicant, more and more enterprises、colleges and scientific research institutes began to seek patent protection. In 2002, total 11 applicants of domestic service inventions mostly include Shanghai Bright Dairy & Food Co., Ltd、Beijing Huafangtianyu Biology product Co., Ltd and etc. The number reached 12 in 2003,,new applications are shijiazhuang Sanlu Group Co., Ltd、xilinguole alliance XinTai Biology product Co., Ltd. etc, and in 2004,the number of applicants increased abruptly to 22,new comers include some famous enterprises such as inner mongolia Mengniu Dairy Product Biology product Co., Ltd、JiLin Dairy group Guangze Biology product Co., Ltd, Heilongjiang wandashan Dairy Biology product Co., Ltd、Shanxi Hengkang Dairy Biology product Co., Ltd. More and more enterprises、colleges and scientific research institutes began to pay attention to exploiting and applying for patent. As a result, it will change the status of non-service patent applications are majority while the technology level is low. Many enterprises have take patent application and strategy as an effective weapon to fight for greater success in market competition and development. whereas enterprises、colleges and scientific research institutes should attach more importance to patent in order to change the characteristic of the dominant status that non service patent accounted for majority.
Table 1
|
|
2002 |
2003 |
2004(not include December) |
|
Service |
13 |
19 |
33 |
|
Non-Service |
45 |
63 |
58 |
(3) Low technology level of the invention applied
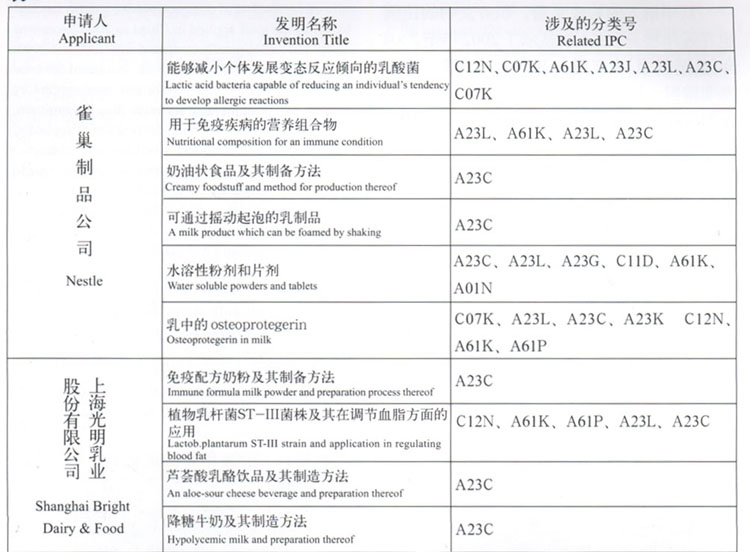
Nestle Co., Ltd of United State is one of the foreign applicants whose application number is enormous. There are 6 pieces of patent applications applied by Nestle Co., Ltd while 4 pieces applied by Shanghai Bright Dairy & Food Co., Ltd in the patent published in 2004,we can realize the distance of the technology level between domestic and foreign industry from comparing above two companies?application in the content, title and IPC of the patent applied. The domestic applications still lay particular stress on formula of products and the displacememt of the raw materials, so the technology field of the patent is more narrow and the number of the foundation patent applications is fewer.
So the direction of the development of the future patent applications must not only attach the attention to the quantity of the patent applied, but also centralize in the improvement of the technology level.
8. Analysis and Forecast on Patent Applications in Photography Area
The photographic technology has experienced development more than 100 years. We are moving into the digital recording era from the past silver salt sensitizing era. Digital camera just went through a dozen of years'development. The patent application on digital camera is increasing in recent years.
Majority of patent applications on photography are foreign applications. The ratio of domestic and foreign applications is severely unbalanced. It is about 1: 9. Applications are centralized in countries such as Japan, the United States, Korea, Germany, etc. while applications from Japan accounted for more than 70%. Most foreign applications are company's service inventions while as the domestic applications are basically non-service inventions. Domestic applications clustered in stereo image and holography area, and foreign applications are basically camera-related. Applications on camera centralized in one-time used camera, APS camera, data recording device, film transfer, photographic lens, digital signal processing, control system, electronic shutter, AF, AE, AWB etc.
Application on one-time-used camera and APS camera probably are a bit more that others in terms of quantity. One-time used camera is characterized as miniaturization and low cost. Miniaturization is performed through reducing volume of parts and optimizing space. Cost could be reduced by reusing some parts of camera, for example, the cost could be reduced by reusing the flash device. Camera fitted with APS film can record not only image, but also information of photographic time and setting. It also allowes picture with different format to be shoot, meanwhile, it can provide data for late printing.
Technology of digital camera has been developing rapidly, now it has tended to be mature. The obvious difference between digital camera and silver camera lies in the sensitive element. Digital camera's sensitive element is image sensor instead of film. CCD is usually used as image sensor. CMOS is likely to replace CCD on some low end product because the index of sensitivity, dynamic range and SNR ect. on CMOS has improved significantly. Digital signal processing is important component on digital camera. Much works on signal processing and calculation need be performed after digital electronic signal is obtained by A/D converting, these works include digital filtering, recombination of image information, data compress etc. In order to obtain function of exact AE, AF, AWB,γ correction etc, many numerical value calculation, optimizing, balance need be performed as well. Digital signal processing device is a special CPU processing vast digital information. Digital signal processing technology is the core technology for digital camera manufacturers. The patent application in this area will be more and more. The latitude of exposure and depth of focus on digital camera are less than traditional silver camera so that the requirement of digital camera is high for the accuracy of exposure of shutter and focusing accuracy of lens, the exposure controlling and focusing controlling are task which are studied by every company, they will apply patent for itself.
No matter what kind of camera it is, silver or digital camera, the quality of image has been continuouslyimproved and more functions have been introduced. With the improvement of processing speed of digital signal, the delay between shutter and imaging will be shortened. There will be various product combining digital camera and other device.
9. Analysis and Forecast on Patent Applications in the Field of Coal Water Mixture (CWM)
CWM is a new kind of slurry fuel appeared in the earlier 1980th, it is called CWM (Coal Water Mixture) or CWF (Coal Water Fuel) and contains about 70% coal, 1% chemical additives, and the balanced water. The heat consumption of water thereof takes only 4% of the total heat value of CWM. The technique of CWM makes it possible for coal to be converted from a traditional solid fuel to a slurry fuel, and therefore brings about lots of advantages. These advantages include that CWM is easy to transport, high in combustion efficiency, easy to adjust in capacity, low in energy consumption and pollution, the technique also has a remarkable efficiency in economic consideration. The CWM study is highly regarded and supported in China, and has now reached the level of the top rank in the world.
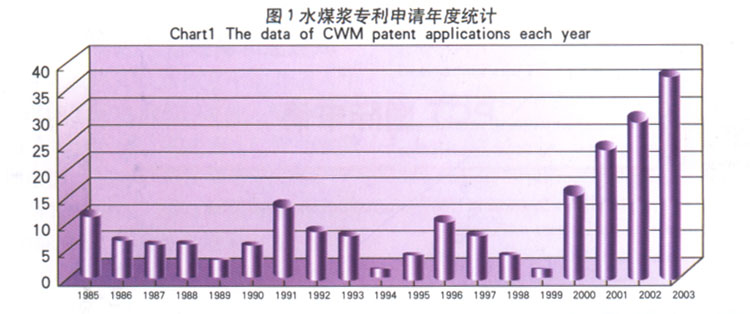
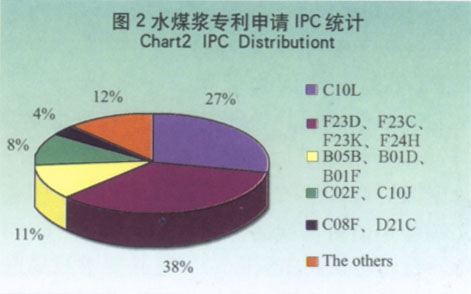
Up to Dec. 2004, among the published Chinese patent documents, the patent applications in the field of CWM has reached 136, relating to the slurry making processes, devices, combustion, transportation and the use of CWM. Chart 1 and 2 reveal respectively the data of CWM patent applications each year and the distribution of the IPC of these applications. They shows that the amount of CWM patent application has experienced three obvious up-and-down since 1985. It is mainly due to the price wave in international and domestic energy source markets. The CWM technique has become more and more active, the amount of patent application kept increasing at the rate around 25% per year. Up to Dec. 2003, the published applications in 2003 had reached 22 pieces, the total number in the year is expecting about 36. These applications are concentrated mainly in the use of CWM slurry preparation(IPC:C10L), combustion(F23D, F23C, F23K, F24H), physical mixing and grinding(B05B, B01D, B01F), CWM vaporization and sewage treatment (C02F, C01J).
In the CWM patent applications, domestic applicants take the majority of 89%, while foreign applicants 11%, mainly from Japan and America. Chinese applicants are mainly China University of Mining & Technology, HuaMei CWS Unite Center, Zhejiang University, East China University of Science and Technology, CAS. The foreign applicants are mainly COM company in Japan and DOW CHEM CO. in America.
According to the technical contents of these patents, Chinese applicants have reached the international leading level in the preparation processes of cleaned coal floatation and washing. But when taking the CWM technique as a whole, national applicants have not yet built up an efficient patent pool, the problems of separated distribution in applicant, of lacking series applications and the narrowness in the technical coverage still remain. Meanwhile, the study of CWM additives has been the key factor in hindering the development of our CWM technology, but this subject has rarely been concerned in the domestic applications. Compared with Japan, of which the amount of the CWM application has reached 1,022, the amount of our CWM applications is relatively low.
Today, as the quickening of the CWM industrialization in China, we have completed CWM preparation plants in ZaoZhuang, XingTai, BaiYang river, DaTong, ShengLi mining, ZhuZhou, etc. For these reasons, we must give a great consideration in making use of patent stratagem to provide an efficient technical support and well survived environment for the advanced development of CWM industry in China.
2013-07-17 Print
Print