
Chapter II Patent Application and Examination
1.The General Status of Patent Applications
In 2002, the SIPO received 252,631 patent applications for three types of inventions, showing an increase of 49,058 or 24.1% as compared with 203,573 applications received the previous year.
By December 31, 2002, an accumulated number of 1,622,631 patent applications were filed with the SIPO. Among them, 1,344,177 were domestic filings, accounting for 82.8% of the total, and 278,454 were foreign applications, accounting for 17.2%.
Since the SIPO officially became a member state of the Patent Cooperation Treaty (PCT) in 1994, the SIPO received a total of 4,372 international applications by December 31, 2002. A total of 4,220 international search copies established 3,767 international search reports. The SIPO also received 2,282 demands for international preliminary examination, and 1,769 international preliminary examination reports. Of the international established applications entering China's national phase, 101,031 filings were for invention patents and twenty-eight for utility models. In 2002, the SIPO received 951 international applications, 937 international search copies, and established 1,001 international search reports. the SIPO also received 697 requests for international preliminary examination, and established 738 reports. Of the international applications entering China's national phase, 22,585 filings were for invention patents and five were for utility models.
Patent filings in 2002 showed the following features: (1) With regard to the number of applications for the three types of patents, the number for invention patents reached 80,232, an increase of 26.9% over 63,204 of the previous year. After the slow period from 1998 to 1999 and the increased peak period from 2000 to 2001, the number began to rise gently. The number for utility models amounted to 93,139, an increase of 16.8% over 79,722 of the previous year. The number for industrial designs was 79,260, an increase of 30.7% over 60,647 of the previous year. (2) According to the national and foreign filings, most of the domestic applications were patents for utility models and industrial designs, accounting for 80.6%, while most of the foreign ones were patents for inventions, accounting for 85.9% of the total. (3) With regard to the constitution of all patent applications, domestic applications of patents for inventions were 39,806, and 40,426 were foreign applications. Domestic and foreign applications took an almost equal share of the total of the new filings. For utility models and industrial designs, domestic applications accounted for more than 90% of the total and almost maintained the same ratio compared with the previous years.
Table 1 Applications for Three Kinds of Patents According to Service and Non-Service in 2002
| ||||||||||||||||||||||||||||||||||||||||||||||||||||||||||||||||||||||||||||||
2. Distribution of Patent Applications by Region, Industry, and Country
Table 2 Distribution of Domestic Non-Service and Service Applications, 2002
| |||||||||||||||||||
|
|
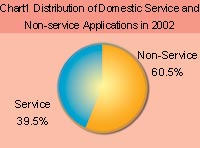
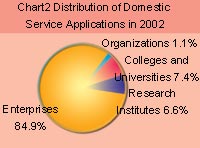
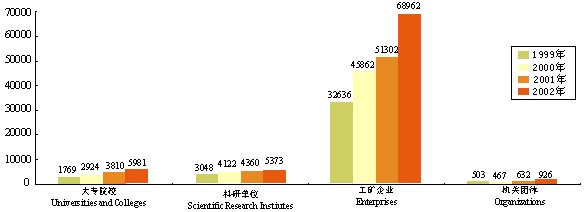
Table 3 Distribution of Domestic Service Applications, 1999-2002
|
Chart 3 Growth of Domestic Service Applications, 1999-2002
As compared with the year of 2001, the ranking changed with regard to the number of domestic patent applications. The top ten provinces and cities were: Guangdong, Shanghai, Zhejiang, Taiwan, Beijing, Jiangsu, Shandong, Liaoning, Fujian and Sichuan.
In 2002, service applications showd a faster and steeper increase than the previous year. The number of patent applications filed by domestic enterprises reached 68,962, a rise of 34.4% against 51,302 from the previous year. The number of patent applications filed by colleges and universities was 5,981, an increase of 57.0% over 3,810 from the previous year. The number of applications filed by scientific and research institutes was 5,373, an increase of 23.2% over 4,360 from the previous year.
By December 31, 2002, applications from 116 countries and regions had filed applications in China. In the year 2002, China received applications from 76 countries and regions, for seven of which were the first-time filers in China. They were from the United Arab Emirates, Cook Islands, the Czech Republic, Mauritius, EL Salvador, Syria and Tunisia. The top ten countries in terms of patent applications, in order, were Japan, the USA, Germany, the Republic of Korea, the Netherlands, France, Switzerland, the United Kingdom, Sweden and Italy.
3. Distribution of Patent Applications by Technical Field
In 2002, the SIPO received a total of 181,422 patent applications for inventions and utility models, an increase of 15.9% compared with 156504 the previous year.
Applications for inventions and utility models were classified according to the IPC. As far as the classification of invention patent applications in 2002 was concerned, patent filings in 2002 showed the following features:
(1) Applications relating to preparations for medical, dental or toilet purposes (A61K) led for the 11th consecutive year in 2002. Among them up to 70% were domestic applications. Applications relating to electric digital processing (G06F) ranked 2nd, while domestic applications accounted for 56.4% of the total Applications related to semiconductor parts (H01L) ranked the 3rd, 60% of which were from foreign applicants.
(2) Applications related to medicine (A61K) and electronic data processing (G06F) ranked among the top three for the seventh consecutive year. The ranking of applications related to mechanical methods or apparatus in the manufacturing of artificial filaments, threads, fibers, bristles, or ribbons (D01D) rose to 3rd place for the first time in the last several years, and the number of foreign applications in this subclass was 2.7 times of that of domestic applications.
(3) The top ten foreign applications focused on the same sub-classifications with those of the previous year, among which foreign applications dominating in proportion were related to information saving (G11B), heterocyclic compounds (C07D), equipment for transfer, exchange and selection (H04Q), each accounting for over 70% of the total in their respective subclass.
Since 99% applications for utility models in 2002 were domestic applications, the above ranking reflected the overall status of domestic utility model applications. For utility model filings, those related to containers or packaging for storage or transportation of materials (B65D) ranked 1st for the ninth consecutive year, applications related to mechanical methods or apparatus in the manufacturing of artificial filaments, threads, fibers, bristles, or ribbons (D01D) ranked 2nd, and applications relating to electronic data processing (G06F) ranked 3rd.
4. Patent Examination and Patent Grant
Table 4 Top Ten Foreign Corporations According to Their Applications in 2002
|
Table 5 Top Ten Domestic Universities and Colleges According to Their Applications in 2002
|
Table 6 Top Ten Domestic Scientific Research Institutes According to Their Applications in 2002
|
Table 7 Top Ten Domestic Enterprises According to Their Applications in 2002
|
Table 8 Top Ten Foreign Corporations According to Their Applications for Invention in 2002
|
Table 9 Top Ten Domestic Universities and Colleges According to Their Applications for Inventions in 2002
|
Table10 Top Ten Domestic Scientific Research Institutes According to Their Applications for Invenion in 2002
|
Table 11 Top Ten Domestic Enterprises According to Their Applications for Invontion in 2002
|
By December 31, 2002, the SIPO granted an accumulated total of 883,035 patents. In 200, 132,399 patents were granted, with an increase of 15.9% over 114,251 from the previous year.
In 2002, 58,989 applications for patents for invention were published. And requests for substantive examination reached 47,365, 1,834 applications were rejected and 9,383 were withdrawn during substantive examination. A total of 21,473 patents were granted for inventions, an increase of 31.8% over 16,296 from the previous year.
As far as utility models were concerned, 57,484 patents were granted in 2002, with an increase of 5.7% as compared with 54,359 from the previous year. 128 were rejected and 9,356 were withdrawn.
In 2002, 53,442 patents for industrial designs were granted, with an increase of 22.6% against 43,596 from the previous year. Twenty-one were rejected and 4,073 were withdrawn.
|
Table 12 Top Ten Provinces and Municipalities
|
Chart 4
|
|
Table 13 Top Ten Countries According to Their
|
Chart 5
|
5. Analysis and Forecast on Vehicle Automatic Transmission Control Technology
Transmission control technology develops continuously with the increasing demand for automobile speed and fuel-efficiency. Auto-shift of automatic transmission can remove the differences of drivers' skill in shift, provide favorable ratio change performance, and greatly improve the vehicle's mobility, economy and emission condition. For this reason, patent applications about transmission control technology mainly focus on automatic transmission, especially hydraulic automatic transmission and continuously variable transmission. According to the distribution of the applications concerning transmission control technology in year 2002, the key technology and development trends of vehicle automatic transmission control are as follows:
(1) Gear increasing of hydraulic automatic transmission control
In order to improve fuel economy, the mechanical part of transmission needs to perform more functions of speed and torque change. As the driving speed of vehicle increasing continually, it is desired to raise transmission speed change range. Hence, speed change ranges of the mechanical part of hydraulic automatic transmission increases continually. In addition, for improving shift smoothness, it's required to lower gear ratio interval between the adjacent gears, so as to facilitate the engine to operate in the best condition. Gear increasing of hydraulic automatic transmission control is a developing trend.
(2) Intelligent control of hydraulic automatic transmission shift point
During shift control, intelligent control system considers many factors, including various influential factors of driving condition, driver's temper and vehicle's performance etc., Intelligent control system can ensure transmission system shift accurately at common driving condition and various special driving conditions. Moreover, many parameters of vehicle will change as vehicle's driving time increasing, intelligent control system can self-regulate in control by recognizing changes of vehicle parameters. Control model used in the intelligent control system is a nonlinear complicate control system, in information recognition and control, more and more modern intelligent control technologies will be used, such as model control, self-adapt control, study control, etc.
(3) High quality of hydraulic automatic transmission shift transition process
Hydraulic automatic transmission shift quality control is always a popular research issue. Shift quality lies in two aspects: comfort and load on assemblies in shift transition process. Many factors are involved in shift transition process, accurate analysis needs to simulate the whole drive system dynamically, but this kind of simulation can't satisfy the requirement of real time control. Analysis of the transition process needs to set up simplified mathematical model, which suit for real-time control. It's also a developing trend, by recognizing vehicle's driving condition and utilizing nerve-net control and other modern control ways to realize high quality of the shift transition process.
(4) Electronic control continuously variable transmission
Continuously variable transmission's speed change process is stable and continuous, it is easy to control. Continuously variable transmission can realize constant power transmission and make engine always run in economic region, greatly improve fuel economy. Continuously variable transmission's mobility and economy is higher than hydraulic automatic transmission by 10% and 15% respectively. In addition, vehicle that equipped with continuously variable transmission need not cut off power during acceleration and has approved overtaking performance. It is comfort to ride in such a vehicle. Cost of continuously variable transmission is lower than hydraulic automatic transmission. Accurate electronic control of continuously variable transmission can match pulley's fluid flow rate with engine's running condition, reduce continuously variable transmission's oil pump power loss, optimize engine running condition, lower fuel consumption markedly.
In future, more advanced intelligent and humanized control technology will be utilized in modern automobile. With the increasing cooperation between China auto industry and advanced corporations of foreign auto industry, it forecasts that the amount of patent applications in the field of automatic transmission control technology will increase.
Table 14 Applications for Patents for Inventions and Utility Models Classified According to IPC in 2002
|
Table 15 Top Ten IPC Sub-Classes of Applications for Patents for Inventions in 2002
|
Table 16 Top Ten IPC Sub-Classes of Applications for Patent for Utility Models in 2002
|
Table 17 Three Kinds of Domestic and Foreign Patents Granted According to Service and Non-Service in 2002
| ||||||||||||||||||||||||||||||||||||||||||||||||||||||||||||||||||||||||||||||
6. Analysis and Prospect on Patent Applications Related to Mobile Communication
The development of mobile communication system has experienced three generations during the last twenty years. Mobile communication system is now in the transitional period from the Second Generation to the Third Generation. The technologies of which are improving day by day and substantially form the systems that are under the standards of WCDMA, CDMA2000 and TD-SCDMA. The total amount of the relevant patent application maintained high. By October 31,2002, there were about 1353 patent applications (not including PCT applications) in the field of mobile communication.
Fig.1 shows the distribution of the relevant patent applications for invention (without PCT applications) by country. Fig.2 shows the percentage of mobile communication technologies according to international patent classifications. From the analysis on which we can get as follows:
1) In the relevant patent applications for invention filed in China, domestic applications amount to 672, which accounts for 48% of the total. It reflected the development of the independent intellectual property right in this field. Meanwhile it can be forecasted that some foreign leading communication companies have paid more attention to PCT application.
2) In view of patents, the technologies mainly focus on H04Q7/32, H04Q7/20, H04J13/00,H04J13/02, H04J14/02, H04B7/00-7/26 (suppressing multiple address interference such as multiple user detection; power control; diversity receiving; evolution of mobile communication networks; GSM/GPRS as well as seamless network architectures). Among domestic applications related not only TD-SCDMA key technologies but also improvement or evolution of WCDMA, as well as GPRS, GSM/CDMA terminal, bluetooth technology service and SMS.
As subscribers pay more and more attention to individuation wireless application services, it is predicted that the amount of relevant patent applications such as basic service, intelligent network service, wireless data service will further increase. Meanwhile since it is an inevitable tendency for the mobile networks to change from circuit switching to packet switching, and further develop into all -IP network architecture and eventually realize the internetworking between different access networks, predicted that mobile Internet, 3G/4G mobile communication, Ipv6, broadband access will be hotspots of patent applications in the years to come.
|
|
7. Analysis and Prediction about the Situation of Patent Application in the Field of Traditional Chinese Medicine (TCM)
This year, a great change has taken place in the medicine administration system for the domestic pharmaceutical manufacture industry. Upon the practice of the Medicine Administration Law (revised) of the People's Republic of China, adopted at the 20th Meeting of the Standing Committee of the Ninth National People's Congress of the People's Republic of China on Feb. 28th, 2001, the Implementing Regulations of Medicine Administration and the Administration Means of Medicine Registration provided by the State Medicine Supervising and Administrating Bureau, the former New Medicine Protection System has been replaced by a medicine inspection-and measurement period of at most 5 years. Meanwhile, the patent right protection has been reinforced in the requirement of medicine registration. Such a great change in the circle of state pharmaceutical manufacturing shows that our administration system in this field has already connected with international system. From now on, the intellectual property protection characterized by patent protection would become a new competition rule in the field of pharmaceutical manufacturing. This would provide a better environment for carrying out the work on patent affairs in enterprises of pharmaceutical manufacture, especially those of TCM that takes a dominant part in the nation.
By 27th, Sep, 2002, TCM patent applications for invention had reached 1447 pieces. Among them, the domestic applications are the absolute majority while the foreign applications are less than 1%. According to the distribution of applicant, non-service inventions decreased comparing with last year, while service inventions increased. The ratio of service inventions to non-service inventions becomes 1:5 while it was 1:11 in the last year. Among the service inventions, patent applications, especially for industries, have increased by 35% compared with last year, while non-service inventions reduced by 55%. It is explained by analyzing the reason of such a reduction for individuals. With the development of patent practice in the special field of pharmaceuticals, it requires a large amount of pharmacological tests and clinic tests during the period between being granted for a patent and getting medicine market permission. The expense for such development is at least more than 100 thousands, which cannot be afforded by individual. Without such research, no examination and approval for a new medicine can be conducted by the State Medicine Supervising and Administrating Bureau, nor a new medicine certificate and producing permission be acquired, and say less about production and sale. As a result, TCM patents for non-service invention suffered a strong obstruction in market permission when they are being put on sale. Though a TCM patent right may be granted, it cannot be put on sale without market permission, therefore it falls into a difficult position when being transferred and carried out. Though the patentee cannot get any benefit, he has to pay for the annual fee to maintain his patent right. As a result, the individual holders of TCM patent tend to abandon their patent rights, meanwhile the enthusiasm for individuals to file an application has also been badly affected, and the individual applications began to decrease. Such a phenomenon shows the reasonable adjustment functioned by patent system, which made the blind enthusiasm of individual applicants become sensible. On the contrary, with the spread of patent policy publicity and the stronger awareness for patent protection in enterprises, as well as the change in competition rules in pharmaceutical industry, the medicine practice body, pharmaceutical manufacture enterprises, and the research and development body, scientific research institutions, began to seek patent protection, in order to take part in a more exciting competition, both technique and market, with the aid of patent according to a more reasonable and current international rules. As a result, among patent applications, service inventions have increased rapidly. It is predicted that such an upturn just begun, and would continue.
According to the technique content analysis upon the TCM applications, the highlight TCM applications, nano or micro-TCM, have decreased abruptly, only 9 pieces, while the research units concerned rose from 1, last year, to 5, which is about 55%. The dosage forms concerned are TCM applying medicine, tablet, oral solution, disinfectant, from which 4 nano-TCM applications are stomach-intestine medicines, 3 applications are skin external medicine, 3 concern single flavor herb, 2 concern multi-flavor TCM. It shows that although controversy for the use of nano-technique in the field of TCM still exists, and the basic research on nano-TCM is rather weak, a lot of research institutes have begun their attempt of TCM modification with the aid of nano-technique. The use of nano-technique has made TCM greatly improved at least in its biological utilization degree represented by the advantage of being acceptable by human body, therefore its application would be perspective. With the accumulation of basic research work, nano-TCM applications would become one of the high-tech points in the field of Chinese medicine.
According to the distribution of patent application for multi-flavor medicine and effective part of plant, the former still takes the majority, while the latter only 2% of the total application this year, but has obviously increased comparing with last year. Nearly all of the latter ones are service inventions, many of them are foreign applications, but the amount of national applications has exceeded that of foreign applications, it shows that more and more domestic TCM research agencies have started their patent research on effective part of plant, and become able to counterbalance with foreign companies. The plants concerned in the effective part of plant patent applications for invention include Rodgersia aesculifolia Batal, Hypericum perforatum L, Valeriana coreana Briq. Polygala aureocanda Dunn, Morus alba L, Dendrobium officinale K. Kimura et Migo, Rosmarinus officinalis L, leaf of Punica granatum L, Pdygonum capitatum Ham.ex D Don, etc.
According to the dosage forms, new dosage forms of TCM applications has begun to increase, the micro capsule, controlled release tablet, emulsion injection, controlled release medicine membrane, liposome oral solution, etc. these patents are also entirely service inventions. The modification upon TCM by new dosage forms represents the developing tendency of TCM modernization today. It may be sure that the application for modified TCM in new dosage forms would become popular.
According to the related diseases being treated, the TCM applications for treatment of digest system disease take the leading place, the followings are skin disease, skeletal system disease, cardiovascular system disease, reproductive system disease, tonic, respiratory system disease, metabolic system disease. According to the specific disease, the TCM applications for treatment of tumor take the first, fibrosis the second, and then those followed respectively: hepatic disease, diabetes mellitus, coronary heart disease, burn, hyperosteogery, fracture and AIDS. What we should notice is the applications for treating AIDS have greatly increased.
Among the applications of TCM for treating tumor, 93% are applications by private persons, only 6 pieces are service inventions including 2 foreign companies' applications. It shows that domestic enterprises and research agencies are not devoted to such market development. According to the situation of individual application, the TCM for treatment of tumor has a considerable potential market, such applications would still be a striking point in future.
As for the trend of application of TCM for treating AIDS, it is estimated, the amount of TCM application concerning treatment of AIDS has reached its top, totally 18 pieces, wherein 95% are individuals'. The more the number of AIDS patients, the greater the market demand for medicine for controlling and healing AIDS would be. Since present TCM applications for treating AIDS are concentrated in individuals without involving any domestic enterprises and research agencies, there would be much potential for such invention to be developed, and therefore such applications would become a new striking point in TCM field.
Among the TCM applications for service invention, the related diseases being treated are sequenced as cardiovascular system disease, respiratory system disease, and gynecologic disease. It shows that the present developing power of TCM enterprises and research agencies is mainly concentrated on the treatment of common diseases that have a broader market. With the growth of fierce competition, the TCM invention in the field of treating common diseases would stay a rising tendency in future.
In general, the TCM patent application shows a favorable developing trend, the technical content in TCM applications is increasing, and the distribution of TCM applicant is changing in a more rational direction. Our patent system would provide a more fair and equitable environment for the technique and market competition in the field of TCM, it would exert a strong propulsion power in the course of TCM modernization and its industrialization.
8. Analysis on Environment Engineering and Forecast on Patent Application
In recent years environment technology has been developing rapidly.
Statistics show that the State Intellectual Property Office accepted more than 200,000 patent applications from home and abroad in 2001. The domestic patent applications related to the environment engineering increased rapidly, mostly including water treatment and recycle, cleaning air, treatment of the industrial solid waste, control of noise, the economical use of energy and so on. The patent applications from abroad related to the environment engineering maintained high. According to origins of foreign applications, applications centralized in several large corporations of Japan, the United Kingdom, the United States, Germany etc.. According to origins of domestic applications, applications centralized in universities, research institutions, large scale enterprises,individual applications and etc..
The ratio of amount of domestic and foreign patent applications is about 1:1 since 1996. But in view of technological content and technological field, there are great differences between foreign and domestic applications. For example, foreign applications are mostly related to newer and higher technology level.
Now two big problems worldwide are the water environment pollution and water resource shortage. The water consumption in the world is increasing rapidly with the continuously economic development, population growth, elevated quality of life and accelerated industrialization and urbanization. The wastewater discharge is increasing respectively and the crisis of water pollution and water shortage become more severe. These were caused almost by a cardinal limitation: insufficient wastewater treatment capacity with low wastewater treatment percentage. In recent years, patented technologies in the water treatment mainly focused on the improvement of raw water quality for the benefit of the people' healthiness, the recycling use of industrial wastewater, agricultural wastewater and city sewage, the desalting of seawater and so on, so as to joint the treatment and utilization, to realize the wastewater innocuousation and resourcelization, to realize the favorable circulation of water cycle and to realize the sustainable utilization of water resources.
Plan the energy of 21 century scientifically and properly is not only a economic problem but also a problem of concerned with political risk. This problem has been shown increasing in world economic campaign near 10 years. The relevant economists demonstration again and again, world economy will develop the peak-hour of energy consumption till 2010,because modern industry rely on energy deeply, from traffic to power as well as each kind of infrastructure construction cannot away from it. In recent years, patented technologies in the energy mainly focused on that how to improve energy efficiency, how to make full use of the biological energy (such as biologic diesel oil) , solar energy and so on which is " typical green energy". For biological energy, it is the energy of environmental protection of a sustainable development, it is to benefit the project of social, improvement environment and continued profit development. Developing biologic energy vigorously for economic sustainable development have important strategic meaning, such as carry energy forward to replace, alleviate environment pressure, control city air pollution.
With China's entry into WTO, patent applications in the field of water treatment and energy utilization are expected to continuously increase accordingly while applications filed by domestic research institutes and large corporations will also increase.
2013-07-17 Print
Print