II. Patent Applications and Grant
1. Patent Applications in Hi-Tech Areas
Table 1 is that of comparison between the Industry Classification and the International Patent Classification (IPC), of which the former one consisting of 24 sub-classes is based upon the Hi-Tech Industry Classification by the Ministry of Science and Technology and the latter one is universally-used. Table 2 is a calculation of the patent applications in Hi-Tech areas from 1997 to 1999. Analysis is then made for applications from various industries and for applications from at home and abroad.
First, the development of four major industries (Table 1).
The total number in 1998 was roughly equivalent to that of 1997, but in 1999, it dropped slightly due to the sharp decrease (40%) of filings from abroad. However, national filings kept increasing by 14.2% each year. In 1999, there was an increase of 40% over the previous year, as a result of which we received as many national applications for inventions as the foreign applications in the High-Tech areas. The biggest increase was from Computer and Office Equipment Manufacturing with annual increase of almost 19%, followed by the increase of around 17% from the Electronic and Communication Equipment Manufacturing. To some extent, it is a symbol of the advance of the two industries and the development of the independent intellectual property rights. Although the number of national applications from Hi-Tech areas enjoyed a big increase, it accounted only for 4% of all applications of the year, which is a great gap as compared to 20% from abroad.
Secondly, the trend of the filings from various industries. As indicated in Table 2, few changes occurred in the ranking positions among the industries in three years. Domestic filings from each of the 4 following industries accounted for more than 50% (1999 statistics) of the total applications. They are, Chemical Medicine Preparation Manufacturing (mainly traditional medicine manufacturing), Electronic Computer Peripheral Equipment Manufacturing, Biological Product Manufacturing, and Chemical Medicine Preparation Manufacturing. Among them, applications from the first two industries covered a range of 60% to 80% of the total number of filings from home and abroad. Particular attention should be paid to Biological Products Manufacturing since foreign applications decreased by more than twice as compared to that of 1998. Nevertheless, national applications increased by four times which meant nearly 90% were national applications. It is of significant importance in changing the foreign patent monopoly in the biological technology product market. However, looking at the high-tech related applications as a whole, we found that applications of high technologies with a leading position in economic development and international competitiveness were from abroad.
Last, we will look at the applications from major foreign countries. Table 3 shows the number of applications from 1997-1999 by the United States of America, Japan, Germany and the Republic of Korea, the four countries with developed economy and patent system. From Table 3, we can see applications from the above four countries accounted for more than 50% of all the foreign applications in China of the year. The two notable industries, Electronic and Communication Equipment Manufacturing and Computer and Office Equipment Manufacturing, accounted for nearly 90% of all the foreign applications, an obvious advantage over the national applications. Taking the Electronic and Communication Equipment Manufacturing as an example, which enjoyed rapid development, extensive application and large consumer market, the number of national applications in 1997 was only 1/7 of that from abroad (only 35.4% of applications from Japan). In spite of the changes in 1999, 80% were still foreign applications. At present, companies in this area include Panasonic, Sony, Hitachi, NEC from Japan, Motorola and IBM from the United States of America, Samsung and Hyundai from Republic of Korea. These are the main brands monopolizing the electronics and communication market in China. Despite the efforts made to enlarge the market share by the national brands, we are still not at an advantage in terms of the inventiveness, competitiveness and brand celebrity.
2.Grant of patents for inventions
(1) Accumulated number
From 1985 to August 18, 2000, 98,000 national applications concluded the examination procedure, of which, 21,000 were published for grant. The closing rate was 68% as compared to the 145,000 national filings for patent for inventions.
As a comparison, about 82,000 foreign applications from 1985 concluded the examination procedure, of which 31,000 were published for grant. The closing rate was 50% as compared to the 166,000 foreign filings for patent for inventions. Applications granted accounted for 38% of those closed applications and 19% of the applications.
In terms of the total numbers of the filings and the issued patent, 46.6% were national applications for patent for inventions, and 53.4% were foreign applications for patent for inventions. Of all the patents issued, 40.2% were issued for national filings and 59.8% were for foreign applications.
(2) Analysis on hot areas of technical innovation
Seen from the issuance rate, a big gap still existed between the national applications for patent for inventions and foreign applications. Despite the fact that we are at an inferior position with regard to the filings and issuance, we own certain advantages in some technical areas.
(a) Comparison on the top ten hot areas for technical innovation
Statistics showed the top ten IPC groups with respect to the issued patents for inventions for national applications.
The table indicates that among the top ten IPC groups, 7 were not only remarkable in the number of issued patents, but the issued rate for national applications accounted for more than 50%, a reflection of strong ability in technological innovation, active research and development, rapid development of the technology, and more shares by highlevel technological innovation, as a result of which more new technologies and new products emerged and the change of the new products accelerated. For example, in group A61, the development of new product and technology involved in Chinese Medicine, hygienical medicine and cosmetic, was very active and was of high quality.
Table 2 shows the top ten IPC groups according to the patents issued for foreign inventions.
Among the top ten IPC groups, 5 are the same as those in the top ten IPC groups according to the accumulated number of issued patent for national inventions, and the only difference is their ranking positions. This shows that, in some areas, the development of the national technologies is basically more or less in compliance with international trend, though not in the same pace.
(b) Changes in the top ten areas of technological innovation
Table 3 indicates the changes in the ranking positions of the number of issued patents for national inventions which can better reflect the development and changes of technological innovations with our own intellectual property rights.
The table shows that the year of 1985 was not taken into account for lack of statistical significance, and only two groups ranked the first for consecutive two years. Before 1994, it was G01 and changed to A61 afterwards. Group G01 had been on the decline after 1994, and eventually faded out from the top ten in 1999, showing the decreasing development of the echnology represented by G01.However, group A61 had been among the top ten positions until it took the first in 1994.The main reason for this was that the patent protection covered the products such as Chinese medicine after the revision of Patent Law in 1992.
3.Patent Applications
In 2000, the Office received 170,682 patent applications for inventions, utility models and industrial designs, an increase of 36,443 or 27.1% as compared with 134,239 of the previous year.
By December 31,2000, an accumulated number of 1,166,427 patent applications had been filed with SIPO. Among those, 972,860 were national applications, accounting for 83.4% of the total, and 193,567 were foreign applications, accounting for 16.6% of the total.
Since 1994 when the Office officially became member state of the Patent Cooperation Treaty (PCT), a total of 1,767 international applications had been received by the year 2000. Also the Office received 1,709 search copies of international applications, of which 1,299 reports were established. In addition, 903 requests were received for international preliminary examination, of which 698 were completed. Among all international filings entering into the national phase of China, 59,419 were for inventions, 19 for utility models. In 2000 alone, a total of 746 international filings and 671 international search copies were received by SIPO, and 364 international research reports were established. The Office also received 267 requests for international preliminary examination of which 230 were completed. Among the international filings entering into the national phase of China, 15,798 were for inventions and 4 for utility models.
What was distinguishable for the patent applications in 2000 was (1) in terms of the numbers of the three kinds of patent applications, the applications for patent for inventions were 51,747, an increase of 41.0% over 36,694 of the previous year. The applications for utility models were 68,815, an increase of 19.7% over 57,492 of the previous year. And the applications for industrial design were 50,120, an increase of 25.1% over 40,053 of the previous year.
(2) With regard to the national filings, most were applications for patents for utility models and industrial design, accounting for 81.9%, while 87% were for patents for inventions among foreign applications.
(3) For the three kinds of patents, there was a big increase of the domestic applications for patents for inventions. In 2000, there were 25,346 applications, an increase of 62.5% over the previous year, which was roughly the same as that of the foreign applications. For utility models and industrial design, the domestic applications accounted for more than 90% of the total.
Table 1 Applications for Three Kinds of Patents According to Service and Non-Service in 2000
4. Distribution of Patent Applications by Region, Profession and Country
As compared with the year of 1999, the ranking position changed with regard to the number of national patent applications. The top ten provinces and cities were: Guangdong, Shanghai, Taiwan, Beijing, Zhejiang, Shandong, Jiangsu, Liaoning, Sichuan, and Fujian.
In 2000, the number of patent applications filed by industrial enterprises reached 45,862, a rise of 40.5% against 32,636 of the previous year. The number of patent applications filed by colleges and universities was 2,924, a rise of 65.3% against 1,769 of the previous year. And the number of patent applications filed by scientific and research institutes was 4,122, a increase of 35.2% against 3,048 of the previous year.
By December 31, 2000, 105 countries and regions had filed their applications in China. In the year 2000, China received applications from 71 countries and regions, 6 of which were the first time to file application in China. They were the Vatican (2), Andorra (1), the Dominican Republic (1), Estonia(1), Morocco (1), Vietnam (1). The top ten countries in terms of the patent applications were Japan, USA, Germany, the Republic of Korea, France, Netherlands, Switzerland, United Kingdom, Sweden, and Italy.
Table 2 Distribution of Domestic Non-Service and Service Applications,2000
Table 3 Distribution of Domestic Service Applications,1997-2000
Table 4 Top Ten Foreign Corporations According to Their Applications in 2000
Table 5 Top Ten Domestic Universities and Colleges According to Their Applications in 2000
Table 6 Top Ten Domestic Scientific Research Institude According to Their Applications in 2000
Table 7 Top Ten Domestic Enterprises According to Their Applications in 2000
Table 8 Top Ten Provincces and Municipalities According to Their Applications Filed in 2000
Table 9 Top Ten Countries According to Their Applications Filed in 2000
5.Distribution of Patent Applications by Technical Fields
In the year 2000, 116,769 applications for patents for inventions and utility models were classified according to IPC, showing an increase of 19.5% as compared with 97,753 of the previous year.

As far as the classification of the applications for patents for inventions was concerned, applications related to compounds for medical, dental, and cosmetic purpose (A61K) took the lead for the 10th consecutive years in 2000, with the domestic applications accounted for nearly 70%. Applications related to electronic data processing (G06F) ranked the 2nd, in which the number of domestic applications was close to that of foreign applications. (2) Applications related to peptide and amino acid (C07K) was on the increase in 2000, ranking the 2nd place. Besides, applications related to medicine (A61K) and electronic data processing (G06F) ranked in the upper echelon for the 5th year. (3) Most foreign applications were related to heterocyclic compound (C07D, information saving (G11B), equipment for transfer, exchange and selection (H04Q), each accounting for over 80% of the total.
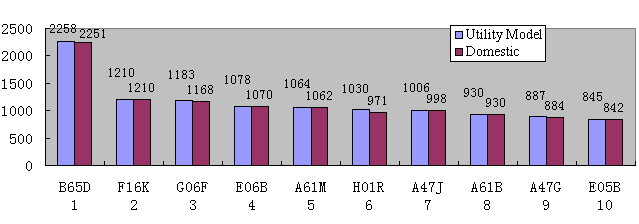
Since more than 95% applications for utility models were domestic applications, the ranking in fact reflected the overall status of the domestic applications for utility models. Those related to containers or packaging for storage or transportation of materials (B65D) ranked the 1st for the eighth consecutive year. Applications related to valves, ventilation, and gas-filing equipment (F16K), electronic data processing (G06F), and door and window equipment (E06B) were also listed in the top ranking positions.
Table 10 Applications for Patents for Inventions and Utility Models Classified According to IPC in 2000
Table 11 Top Ten IPC Sub-Classes of Applications for Patents for Inventions in 2000Table 12 Top Ten IPC Sub-Classes of Applications for Patent for Utility Models in 2000
6.Patent Examination and Grant
By December 31, 2000, SIPO had granted a total of 636,385patents. In 2000 alone, 105,345 patents were granted, an increase of 5.2% over 100,156 of the previous year.
In 2000, 38,290 applications for patents for inventions were published, and requests for substantive examination reached 33,449, of which 961 applications were rejected and 5,820 were withdrawn. A total of 12,683 were granted patents for inventions, an increase of 66.1% over 7,637 of the previous year.
As far as utility models were concerned, 54,743 patents were granted in 2000, a decrease of 2.9% as compared with 56,368 of the previous year. 273 were rejected, and 9,841 were withdrawn.
In 2000, 37,919 patents for industrial design were granted, an increase of 4.9% against 36,151 of the previous year. 21 were rejected and 4,543 were withdrawn.
Table 13 Three Kinds of Domestic and Foreign Patents Granted According to Service and Non-Service in 2000
7.Prospect for the Technical Development of Bio-fertilizer
"Bio-fertilizer" refers to the technologies on the basis of vital process of microorganisms so as to generate special fertilizer effects for crops, which include two types of invention: inventions related to process for manufacturing bio-fertilizer by use of micro-organisms and inventions related to the product of bio-fertilizer including organism, and most of the bio-fertilizer belong to the latter.
The research and application of bio-fertilizers in China started soon after the founding of P.R. China. At first, nodule bacteria was inoculated for leguminous plants. During 1950s, the agents of autogenetic azotobacteria phosphor-decomposing bacteria and silicate bacteria were introduced from USSR. Chinese scientists successfully developed "5406" antibiotic fertilizer (actinomycetes) and nitrogen-fixing bio-fertilizer containing cyano-phyceae, and also VA mycorrhiza from soil fungus between 1970s and 1980s, which improved phosphor nutrition for plants and increased the utilization ratio of moisture. During 1980s to 1990s, they utilized combined azotobacteria and potassic bio-fertilizer as mixed agents for seeds, and at present, extend to use bio-fertilizers made from nodule bacteria, azotobacteria, phosphordecomposing bacteria, silicate bacteria, and organic composite fertilizer as base fertilizers.
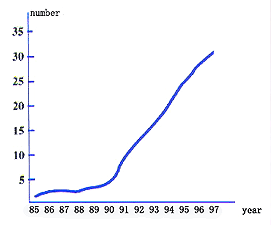
Since the implementation of the patent law in 1985, the variation of the number of patent applications related to bio-fertilizer is showed as the following figure.

Fig 1 Variation of the number of patent application related to bio-fertiliser
As shown from the figure, the patent applications related to biofertilizer had a rapid development in 1991. At present, there are about 30 such patent applications each year in China. We believe that with the development of high technology, especially, of bio-technology and continuous pursuance to modern agriculture of our country, the number of the patent applications related to bio-fertilizer would increase, which will result in a great influence on our agriculture for a long time.
We believe that the following aspects will be the development trend of the bio-fertilizer in our country.
(1). From single species to composite multi-species
As the efficiency of a bio-fertilizer is not the result of a single function, the combination of multispecies is consequent. At present, most of the bio-fertilizers produced in China combine many microorganisms, such as nodule bacteria, azotobacteria, phosphor-decomposing bacteria, silicate bacteria, and so on, therefore to take advantage of diverse mechanisms to crops from different organisms and attain several synergistic effects.
(2). From inoculants to composite bio-fertilizers
As it is difficult to meet the requirement of vast farmlands for fertilizers when the effective species are formed into inoculants, the soil was made harden as the result of reduction of farmyard manure applied and the base of fertility was affected. This phenomenon has become the biggest barrier which impedes the further development of our agriculture. The use of bio-fertilizer made by combination of microorganisms and organic manure can greatly increase the amount of beneficial root colonies and active organics as well as nutrient elements.
(3). From unifunctional to multipurpose
Although there has been a dispute about mechanism of microorganisms for many years in the field of bio-fertilizer, the basic common ground is that the function of each microorganism is not unitary. For example, certain azotobacteria can inhibit infectious bacteria except nitrogen fixation; certain chlordimeform bacteria also possess bacteriostatic effect; and many soil microorganisms can stimulate the growth of plants. As the knowledge to bio-fertilizer growing, there must be a higher, more comprehensive demand upon this kind of fertilizer, which request the bio-fertilizer to improve nutrition of plants, activate the growth and restrain infectious bacteria. Therefore, the future biofertilizer should progress in the direction toward multifunction, which request the bio-fertilizer to exhibit efficiency, improve quality and appearance of crops, and to prevent and cure plant diseases and insect pests, regulate the maturation period of crops and so on.
(4). From non-spore-bearing species to bacillus
The rhizobium and azobacter used by the prior bio-fertilizers pertain to non-spore-bearing species. Being not thermostable and aridity-resistant, these species have a lower anti-retroaction and have no reserve intolerance, therefore the bio-fertilizer should be in liquid form or adsorb microorganisms in certain carriers such as vermiculite so as to facilitate storage and transportation. However as the applied range of bio-fertilizers expands and its use level increases, the transportation and fertilization of bio-fertilizer in the form of liquid or adsorption will become more difficult, especially for commercial purpose. Using bacillus as the species of bio-fertilizer can prevent the above-mentioned situations. For example, many patent applications suggest using B.megatherium, B.polymyxa and B.mucilaginosus. These spore-bearing species and their variants are thermostable and aridity-resistant, therefore, the bio-fertilizer including them can be made into dry powder or granule to stockpile for a long time.
As the society pays more and more attention to environmental protection and the ecological agriculture development, the bio-fertilizer of our country certainly develops more quickly. There are more than seventy countries in the world that have been promoting the application of bio-fertilizers, and the use ratio has reached half of gross fertilizer in the developed countries, which is substituting for chemical fertilizers. Although the research work has been conducted for nearly 50 years in China and there are several hundreds of manufacturing plants, China has got behind the developed countries in either research or production considering their scales, profundity, scopes and applications.
8.Analysis and forecast of Nano Technology
The nano technology has been developing rapidly in recent years. The amount of patent applications related to nano materials and technology increases rapidly in China, the total number of patent applications in the fields of nano technology in SIPO (State Intellectual Property Office of China) is approximately 312, most of them were filed by Chinese applicants. There are 149 patent applications since 1997, the applications for protection of inventions reached 136; most of applicants are Research Institutes, Universities or Colleges, and Enterprises. According to DERWENT database, the patent applications in the field of nano technology filed by foreign applicants increased greatly in the past two years. The patent applications in the field of nano technology since 1999 are shown in table 1.
Analysis:
a)The patent applications in this field are mainly from China, United States, Germany, Japan, Korea and so on.
b)The applications are generally divided into three types: that is nano materials and their products, process and their apparatus, the use of nano materials. As to chemistry field with the most number of patent applications, nano materials mainly relate to metals and alloy, nonmetal, oxides, coating compositions, polymer composites, catalyst, ceramics, monocrystals, medical products and cosmetics.
c) Applications filed by domestic applicants mainly relate to process for preparing the nano materials. Foreign applications mainly relate to the use of nano products.
d) Regarding the process, there are gaseous phase and solid phase method in addition to conventional sol-gel method and thermolysis method, in which the modem technology are used, for example the radiation, ultrasonic wave or laser and so on.
e)The products of the nano materials relate to many fields. Domestic and foreign applications simultaneously focus on ceramic, coating, medical products or cosmetics. The amount of foreign patent applications in the fields of magnet and optics devices is more than that of domestic patent applications.
Prediction:
a) The amount of foreign patent applications will be increased rapidly from next year. The inventions mainly focus on new nano material, their products, their use and new process. At same time, The amount of domestic patent applications will be increased too; they will focus on the nano products, process and their apparatus.
b) In the Organic Chemistry aspect, the amount of patent applications related to three kinds of nano lubricant material including particulate additives of lube oil modified by organic acromolecule, polymer composites or metal-polymer multilayer composite and organic ultra-thin lubricant film enhanced by nano material will be increased.
c)The patent applications will focus on nano carbon tube in the near future. The study and development will concentrate on embattle of nano carbon tube.
d)The amount of patent applications having development foreground for nano technology which will be used in the fields of hydrogen fuel source, information technology, process for preparing nano particulate having biological activity, nano material to be used for pharmaceuticals, medical products, cosmetics etc. will be gradually increased in the future.
9.Analysis of Mobile Communication Technology and Forecast of Patent Applications in this Field
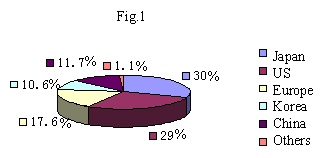
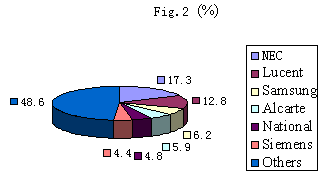
In recent years, the technology of mobile communication has been de veloping rapidly, and the amount of patent applications occupies a larger percentage of the patent applications in communication field in China. The number of patent applications in 2000 is not changed much, compared with that in 1999. Fig.1 shows the percentage of the patent applications submitted by some countries and regions in 1999-2000. Fig.2 shows the percentage of the patent applications submitted by some leading companies.


What we can see from the statistical data is: the applications mainly come from some leading communication companies of America, Japan, Europe, and Korea, such as NEC of Japan, Samsung of Korea, Lucent of USA, etc. while, the number of the patent applications in the mobile communication filed by domestic communication companies is increased slightly. In view of the patent, the technologies of the applications mainly focus on power control, diversity receiving, hand off, terminal device and basic technology.
It is expected that the patent applications of, such as intelligent antenna, baseband processing, power control, hand off technology, congestion control, and resource assignment & management, are to be a hotspot of the patent applications for a later period of time, since developing 3G product is in hot pursuit today by the communication companies. Also, potential patent applications will be on a compact image mobile terminal wherein Wireless Access Protocol (WAP) is used.
Therefore, patent applications for mobile communication technology will remain as a hotspot of patent applications in China; the number and percentage of patent applications filed by some domestic communication companies will be increased later on.
2015-07-31 Print
Print